
 RevPAR and RevPAR index are different. Let’s clarify both of them.
Let’s start with RevPAR
It is the cornerstone of the hotel world and rightfully so. It is the product of occupancy and rate smashed together. The acronym stands for “revenue per available room.”
In a simple example: If my hotel was 60 percent occupied last night and my average rate was $100, my RevPAR would be $60 (100 x .6). The other way to calculate this would be to take the total rooms in my hotel—in this example it is 500—and divide that by the total room revenue last night. At 60 percent that means I had 300 rooms occupied and I will multiply that by $100 to get my room revenue (300 x 100 = $30,000). To calculate the RevPAR, I divide the room revenue by the rooms available. ($30,000/500 = $60). I can calculate the RevPAR for any period—week, month or year—the same way.
One last thing I will say about calculating RevPAR is that it is a relatively new thing. I do not want to draw too much attention to my age here but when I went to hotel school, RevPAR was not on the menu. It was only occupancy and average room rate.

RevPAR index is a concept that was developed about 30 years ago as best I can tell. I remember being introduced to it at a budget review meeting and I thought it was pretty cool. In those days we would do a call around to find out what the other hotels in our city were doing each month for occupancy and rate. I am pretty sure some of the hotels fabricated their results and I think a few others thought the same.
Somewhere around the mid 1990s, a company started a business based on capturing and sharing the occupancy, rate and RevPAR for hotels. They sold a subscription and hotels shared their results every day on the previous day’s occupancy and rate. The company now gathers this information for your hotel and your competitors, and then they share the information so you can see how well you are doing vs. your competitors.
Let’s now look at how we calculate RevPAR index
The reasons why we want to calculate the index are important to know.
The first reason is this calculation will allow you to see how well you are executing your sales and revenue management strategies relative to your competition. Given the current product you have, how well are you selling the hotel?
The second reason is the index shows you what your variance is relative to your competitors and what the gap is worth. Let’s say your index is 15 percent below the set. This means that with a potential investment in your product you could close or beat that gap and that translates into potential dollars of profit to justify your investment.
The third reason is to continually be aware of how your hotel is positioned relative to its competitors, so you can see if your rate and occupancy strategies are working. Maybe you want to lead on rate because you feel in the long run this is the best game plan for your asset, and the index will tell you the answer.
Choosing a competitive set of hotels can be difficult and it needs to make sense. If you are in a busy city setting, this can be easier because there is a large available selection of hotels to choose from. If you are in a resort setting, look at hotels that are similar in product and service to yours. Once you choose your set, you are not going to want to change it unless there are very good reasons to do so—perhaps a new hotel in your market place.
Having a positive index, which is an index above 100 percent, is where you want to be. The bigger, the better.
In many HMAs (hotel management agreements), having and maintaining a positive index is an important test. In some HMAs, the manager is required to maintain a positive index or they can lose the contract to manage the hotel. This can be a costly problem for the management company because losing the flag means you just lost all the fees from that hotel. You might even find yourself in a situation where you have to make up the lost profit and pay it to the owner.
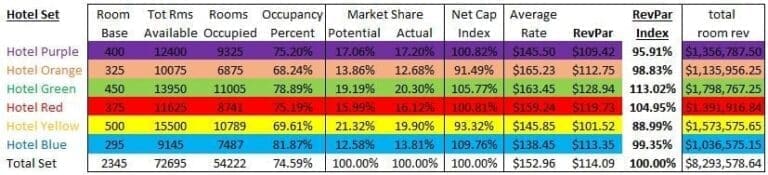
Above is the chart that lays out the RevPAR index calculation. Think about the index like a dessert that your mom made. She is placing that pie on the kitchen table and you want to make sure you get your fair share. The chart shows you what your slice is really worth.
Looking across the top of the chart:
- We start with each hotel’s Room Base, the number of rooms in each hotel.
- We then multiply the number of rooms by the days in the month to get Total Rooms Available.
- Next, we enter the actual Rooms Occupied for the month, followed next by the percentage of occupancy for this month for each hotel.
- Following those are the potential and actual share based on occupancy. This is the first point where we see the individual performance of the properties in relative terms on only occupancy to their competitors.
- This produces the net capture index.
- The next step is to add the monthly average rate which produces the property room revenue in the column on the far right.
- Once we have the room revenue we can calculate the individual hotel RevPAR.
- Once you have the RevPAR, divide it by the overall RevPAR of the sample set to produce the RevPAR index.
That’s a lot of math but it’s really a simple set of calculations.
If you want a copy of my spread sheet send me an email requesting it and it will be my pleasure to send it to you.
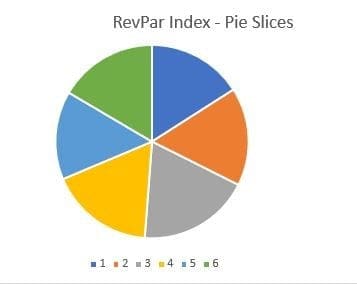 RevPar Index – Pie Slices
The chart at right shows the index slice sizes.
When I was growing up it was very important to get my fair slice of the pie at mom’s dinner table, how about you?