 Direct bookings are essential for hotel brands to be successful, yet performance management of this channel is sometimes insufficient. Data analytics can help you better understand your direct channel performance, but the true value comes from being able to compare your brand to the market to identify opportunities for growth.
With hotel benchmarking, hoteliers are able to use valuable competitive insights to make better-informed decisions and take action where it matters most. However, it can sometimes be difficult to know which metrics you should be paying attention to.
At The Hotels Network, we recently released an ebook for hoteliers, 10 Direct Channel KPIs. In this highly practical guide. we introduce a brand-new KPI framework that highlights the top metrics to focus on when evaluating the direct channel success of your hotel, including THN’s very own KPIs.
For each KPI, we explore the metric by looking at:

- What it is
- How to calculate it
- Why it is important
- Which score is considered good
Below you can find a brief introduction to the metrics covered in the guide.
1. Total Conversion Rate
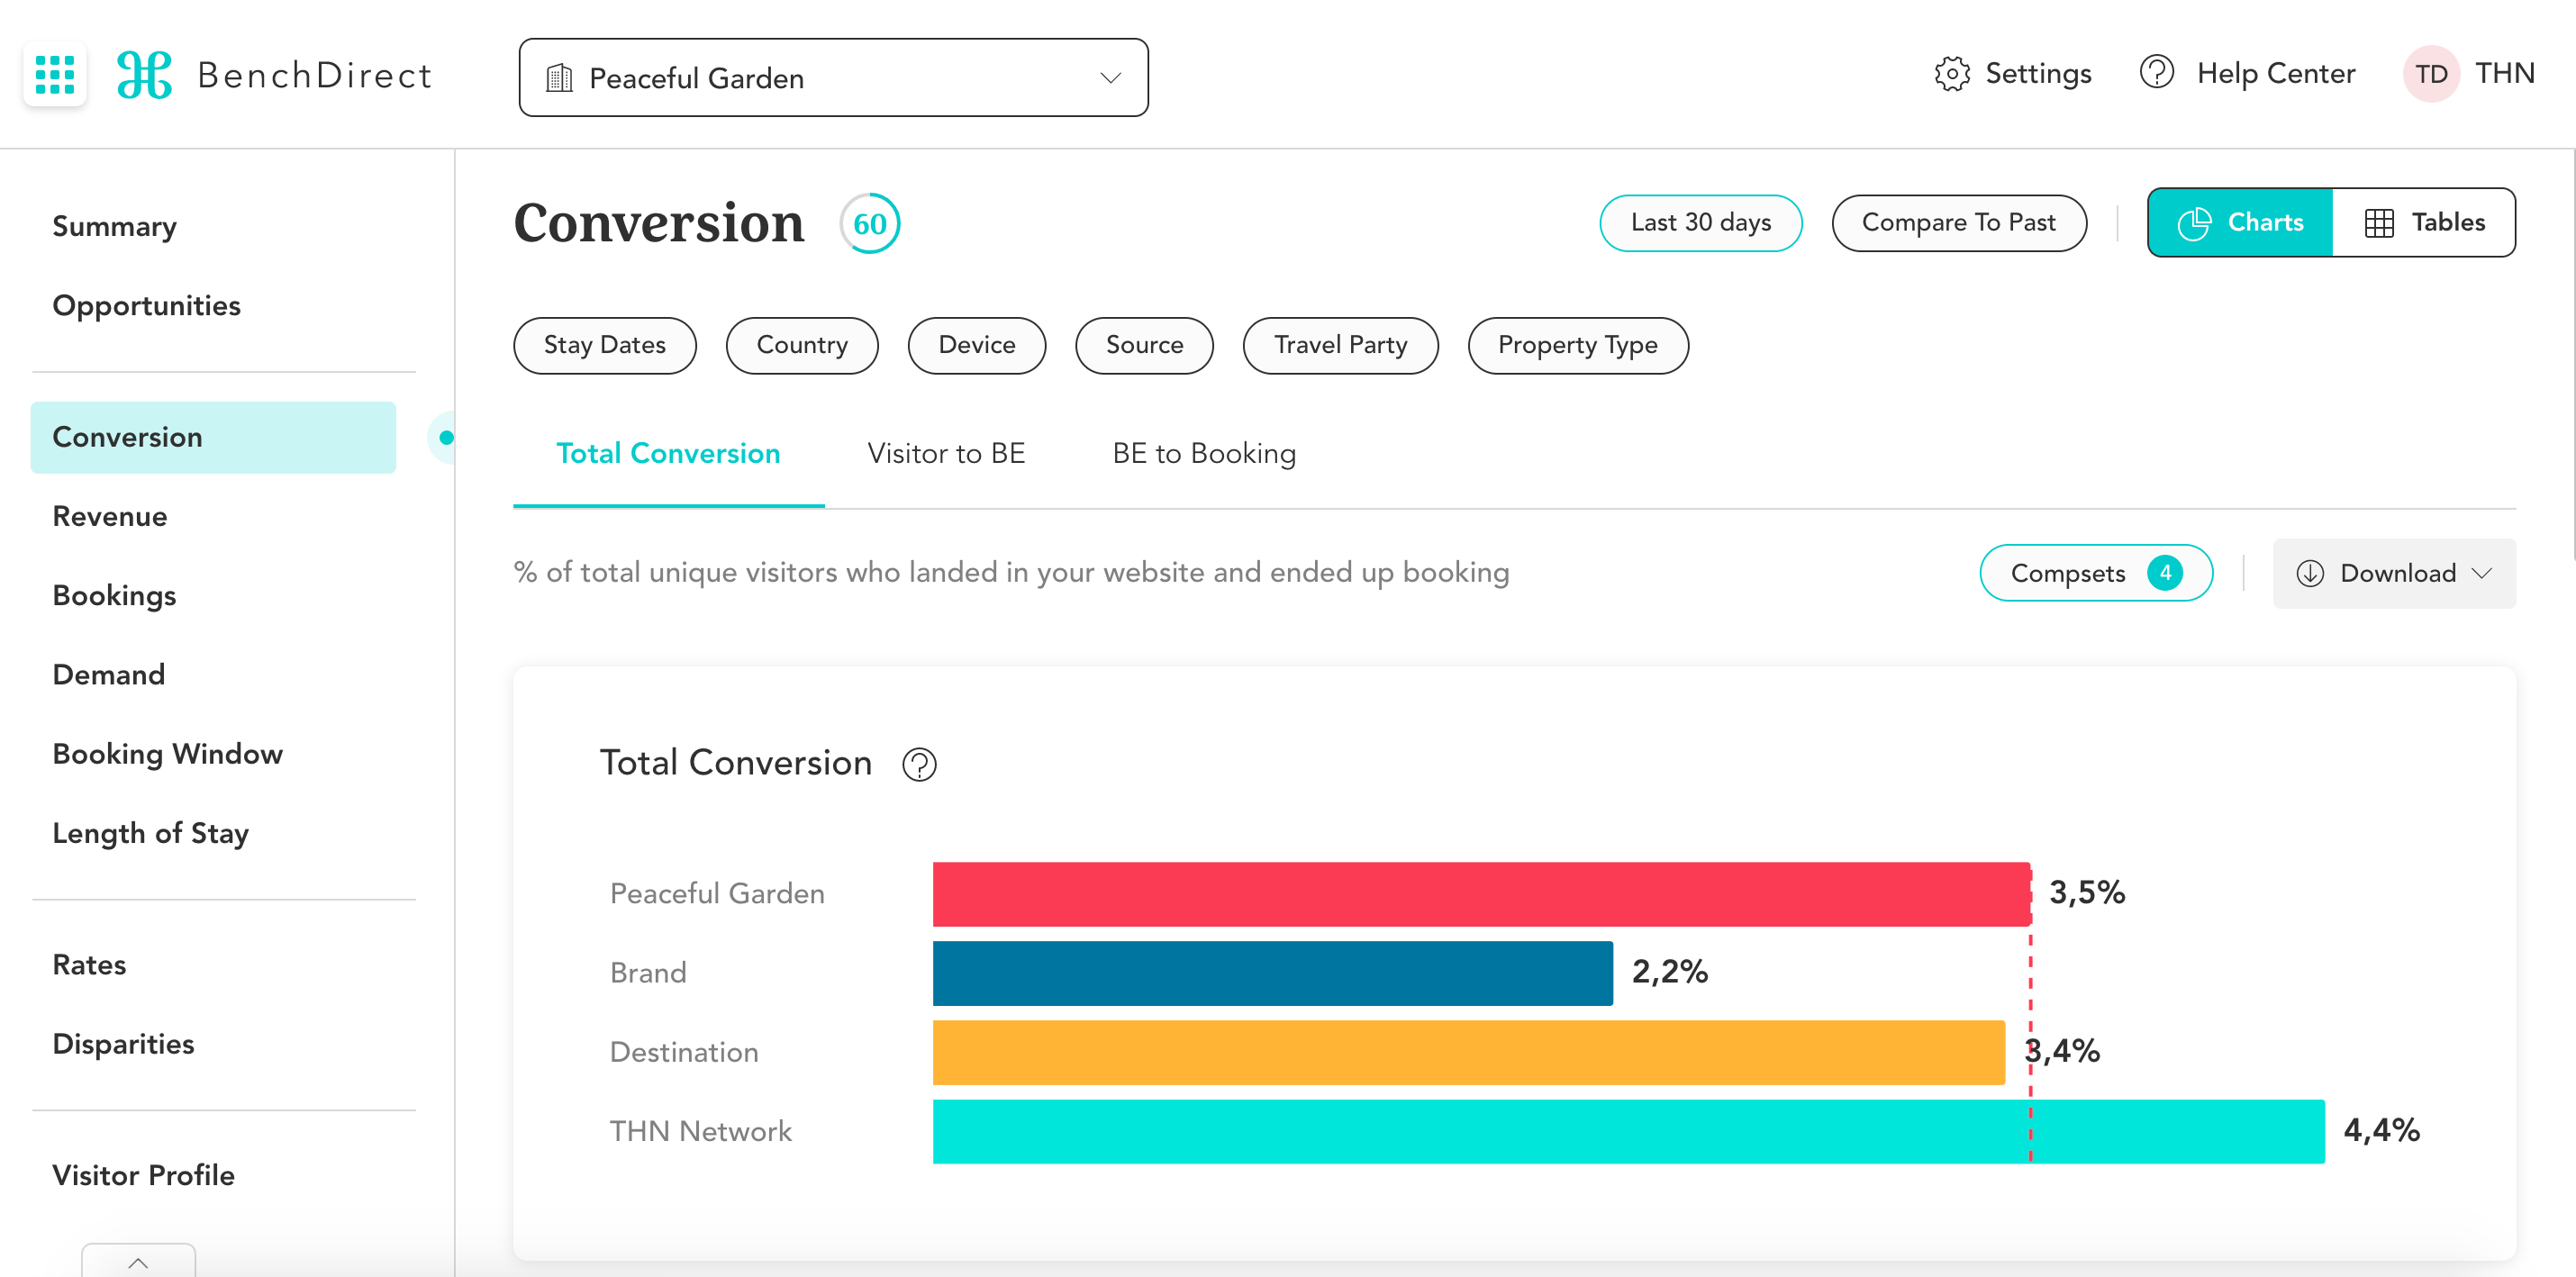
Total conversion pertains to direct conversions only. The conversion rate is defined as the percentage of the amount of website bookings received during the selected period compared to the number of visits to your hotel website.
2. Visitor to Booking Engine (BE)
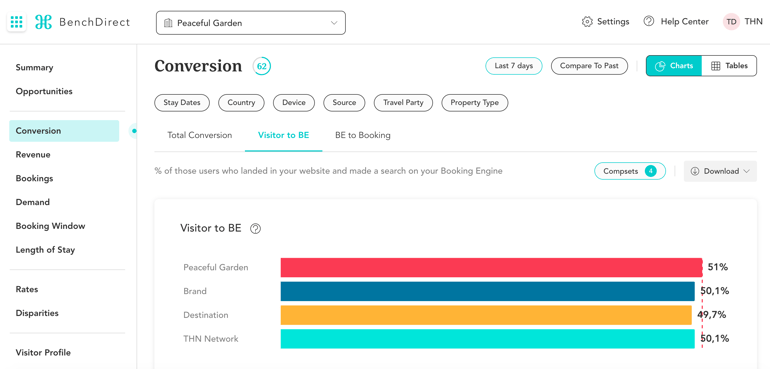
One of the most important steps in the booking funnel, Visitor to BE is defined as the average conversion rate from those users who landed in your website to those who made a search on your booking engine.
For hotels, Visitor to BE conversion rates typically range between 35% to 55%. An effective way to improve these numbers is by showcasing relevant and personalised content on your homepage and by Including a clear CTA in marketing messages to drive more visitors to your booking engine.
3. Booking Engine (BE) to Booking
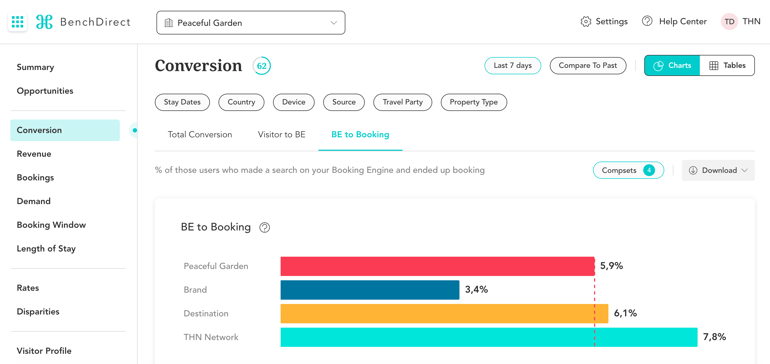
BE to Booking is defined as the average conversion rate taking into account only those users who made a search on your booking engine and ended up booking a stay at your hotel. Often ranging from 5% to 15%, conversation rates at this stage of the booking funnel tend to be lower than those for Visitor to BE.
4. Average Daily Revenue
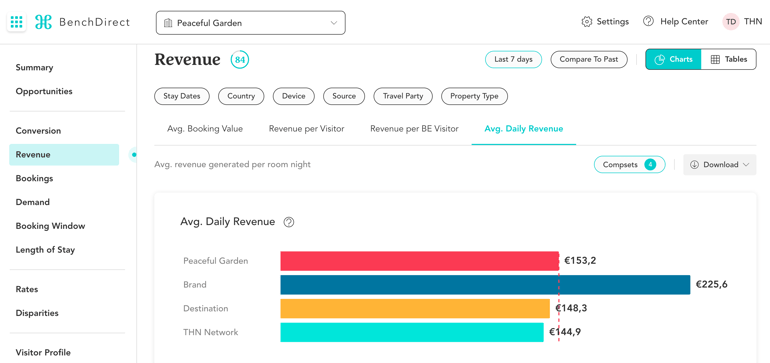
Average Daily Revenue is defined as the average revenue generated per room night reserved on the hotel website for the selected period of time. Measuring Average Daily Revenue is useful because it indicates the average price that guests pay for booking a room night on your website, which obviously has a direct impact on the revenue of your hotel.
5. Direct Occupancy Rate
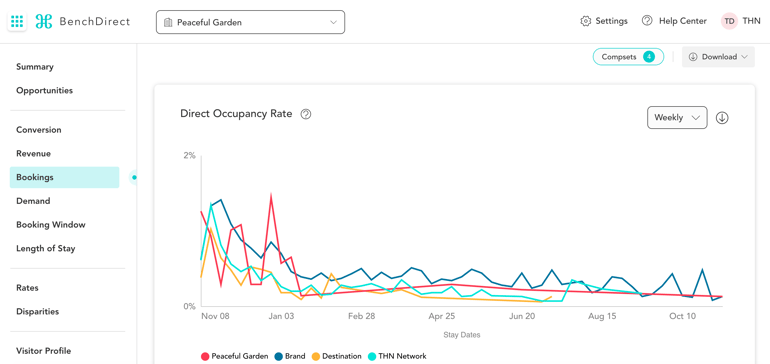
Direct Occupancy rate is calculated by dividing the total number of rooms booked on the direct channel by the total number of available rooms for a specific period (looking at stay dates) and multiplying this number by 100. Your Direct Occupancy Rate reflects how much of your room inventory has been sold on your hotel website in any given period, which is a good indication of how well you are selling your rooms through the direct channel.
6. RevDirect
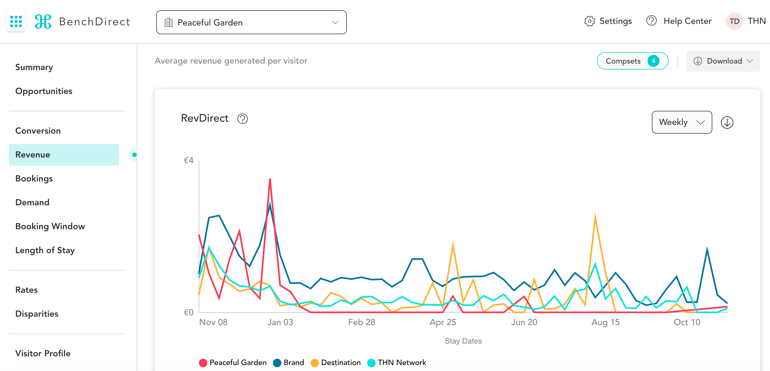
This is the Revenue Per Available room for your direct channel only. RevDirect is calculated by dividing the total direct room revenue by the total number of available room nights (looking at stay dates). Concentrating on growing RevDirect will allow you to increase the revenue per available room specifically for your direct channel.
7. Disparities Frequency
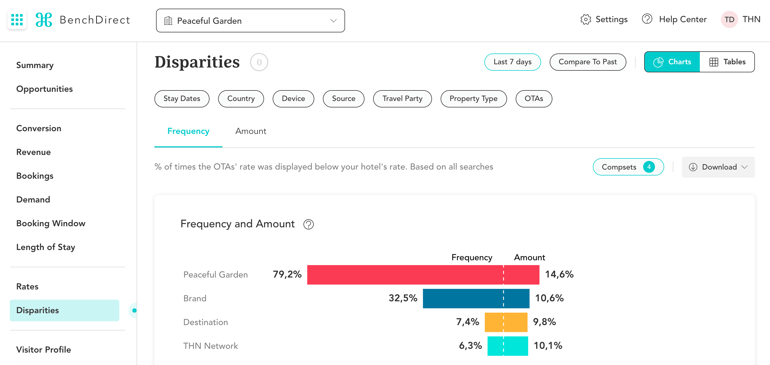
Disparities Frequency is defined as the average percentage of times the OTA’s rate was cheaper than the hotel’s rate when a search was made on a hotel website during the selected period. The rate varies by market and by OTA but it is quite common to see an average range of between 10% to 30%. It is critical to be able to reduce the frequency of price disparities because we know that if guests can find a cheaper rate elsewhere, this will significant lower hotel website conversions.
8. Disparities Amount
Disparities Amount is an important metric because it tells you on average, how much lower the OTA rates are compared to the rates on your own hotel website. It is defined as the average percentage of price difference between the hotel’s rate and the OTA’s rate for searches in the selected period of time. To have a lower Disparities Amount, you need to closely monitor and control the price of your rooms on external sites in order to guarantee your guests that you are offering the best available rate on your website at all times.
9. Demand
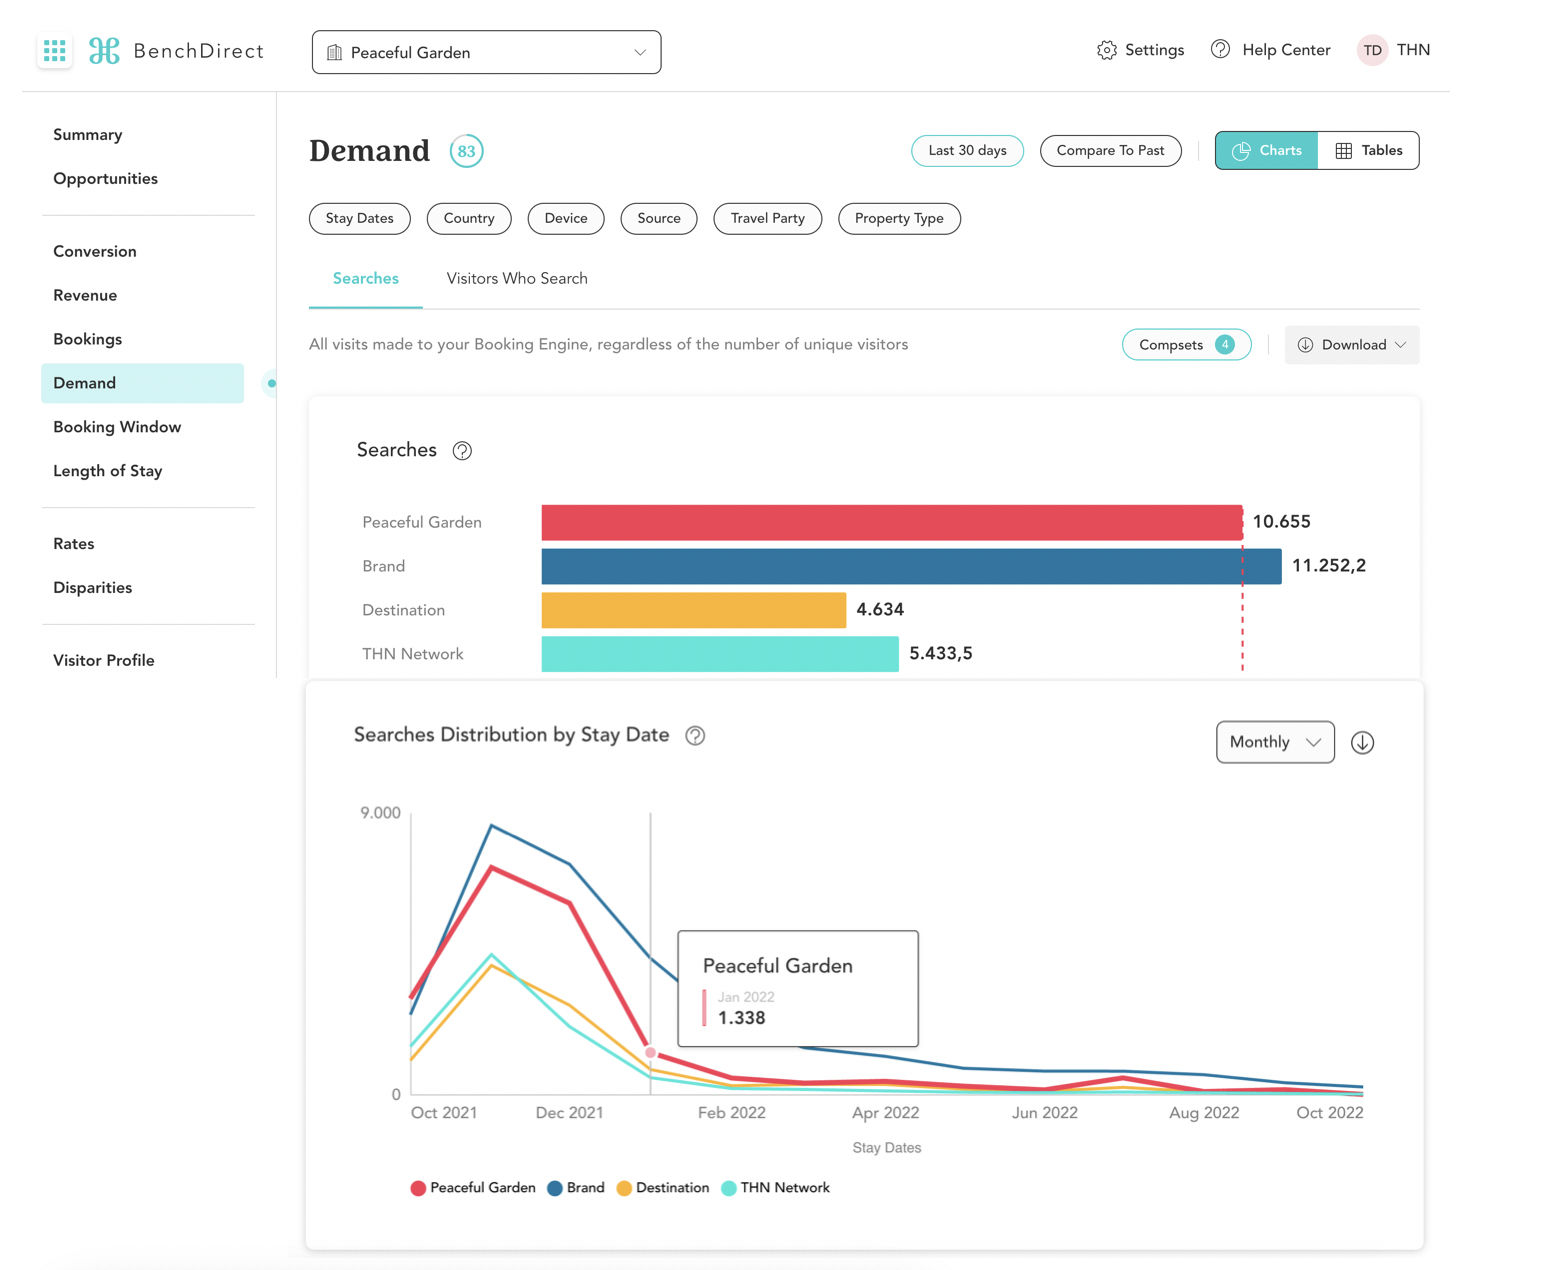
Demand can be defined in two different ways. By Searches, looking at all the searches made on your website during the selected period regardless of the number of unique visitors. By Visitors who searched, looking at the number of unique visitors who made a search on your website, regardless of the number of searches they may have made.
Monitoring demand becomes even more relevant when you relate it to stay dates. By looking at the distribution of demand by stay date, you can see where the spikes in demand are occurring so you can get ahead by capitalizing on those hot spots.
10. Direct Booking Index (DBI)
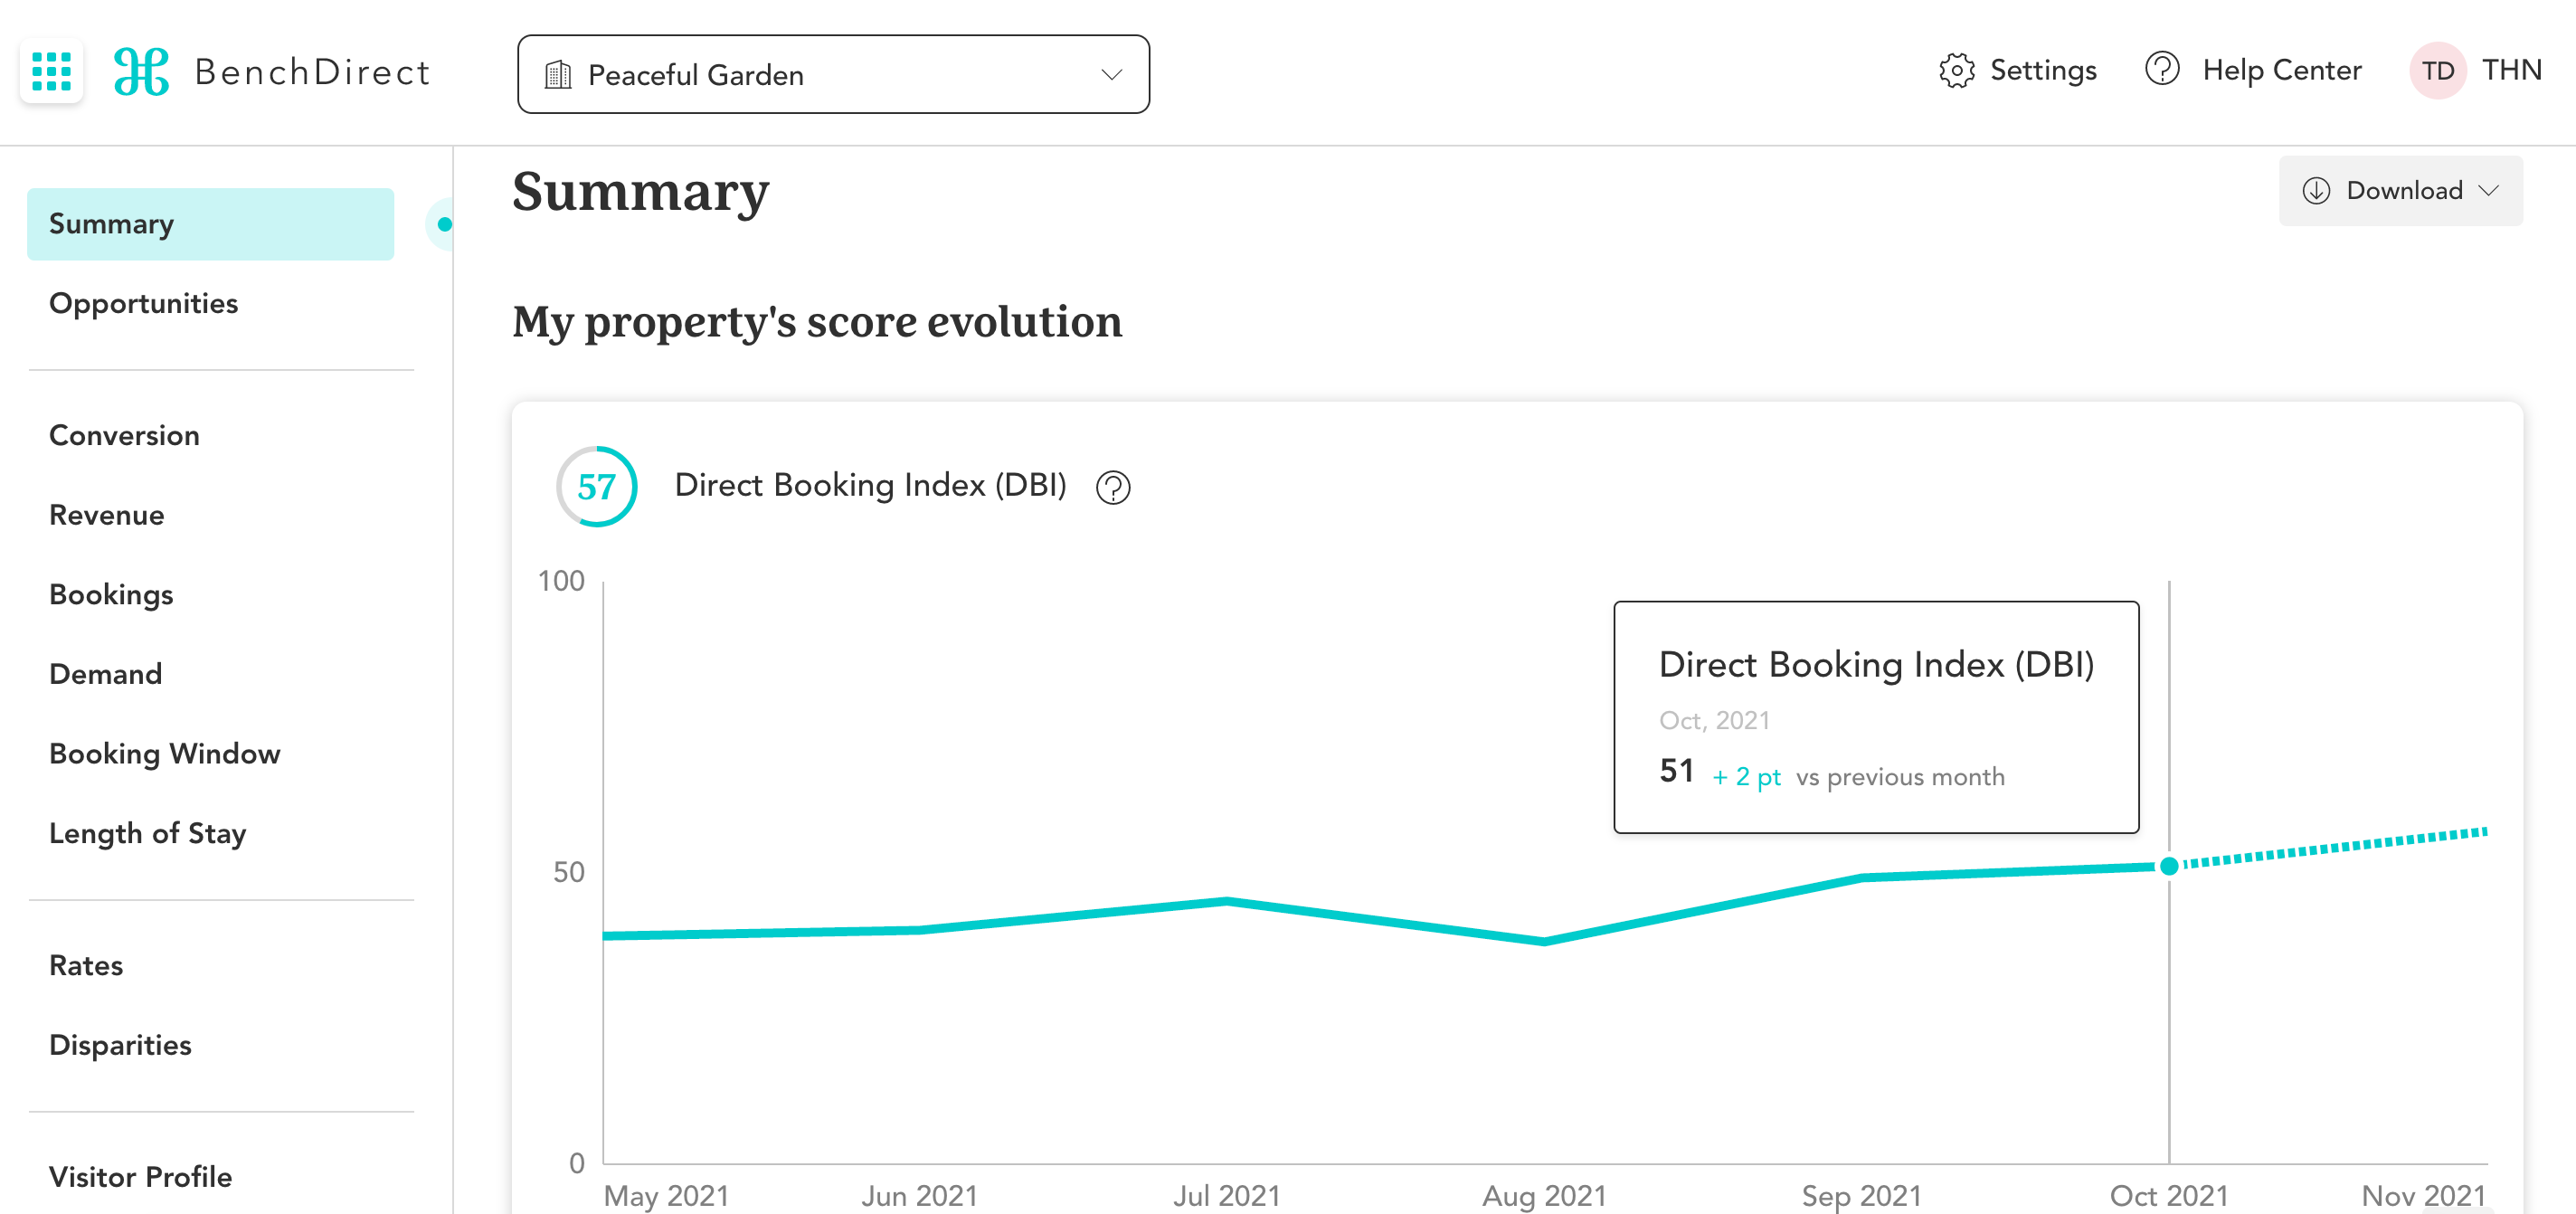
Developed by THN, the Direct Booking Index™ (DBI) is an overall score to measure your hotel’s global performance versus the market in terms of an effective direct channel strategy. Calculated by weighing algorithmically each section involved in your direct channel strategy, it enables you to track the monthly evolution of your hotel’s performance over time.
DBI ratings range from 0-100 points, 100 being the highest achievable score. The higher your DBI, the better. We consider a strong DBI to be above 50, which means that in terms of direct channel performance, you are in the upper half of the market.
Since performance indicators are used to analyze a company’s activity, operations, and results, the purpose of this guide is to help you better understand the direct channel KPIs that every hotelier needs to know in order to provide maximum value to their businesses and for your direct booking growth success.
For more details on this new KPI framework for the direct channel, download our full guide. To start benchmarking your hotel’s direct booking performance compared to the market, request your BenchDirect account today. The platform is free for hotels to use, forever.