![]() Revenue management is a crucial element of hotel operations and involves implementing various pricing strategies for different hotel rooms. These pricing strategies are known as dynamic pricing or “price tags.” When adopting revenue management practices, you’ll want to understand these pricing approaches to interpret your hotel’s pricing patterns accurately. When you understand these, you can implement revenue management and maximize your hotel’s revenue potential while minimizing losses.
Revenue management is a crucial element of hotel operations and involves implementing various pricing strategies for different hotel rooms. These pricing strategies are known as dynamic pricing or “price tags.” When adopting revenue management practices, you’ll want to understand these pricing approaches to interpret your hotel’s pricing patterns accurately. When you understand these, you can implement revenue management and maximize your hotel’s revenue potential while minimizing losses.
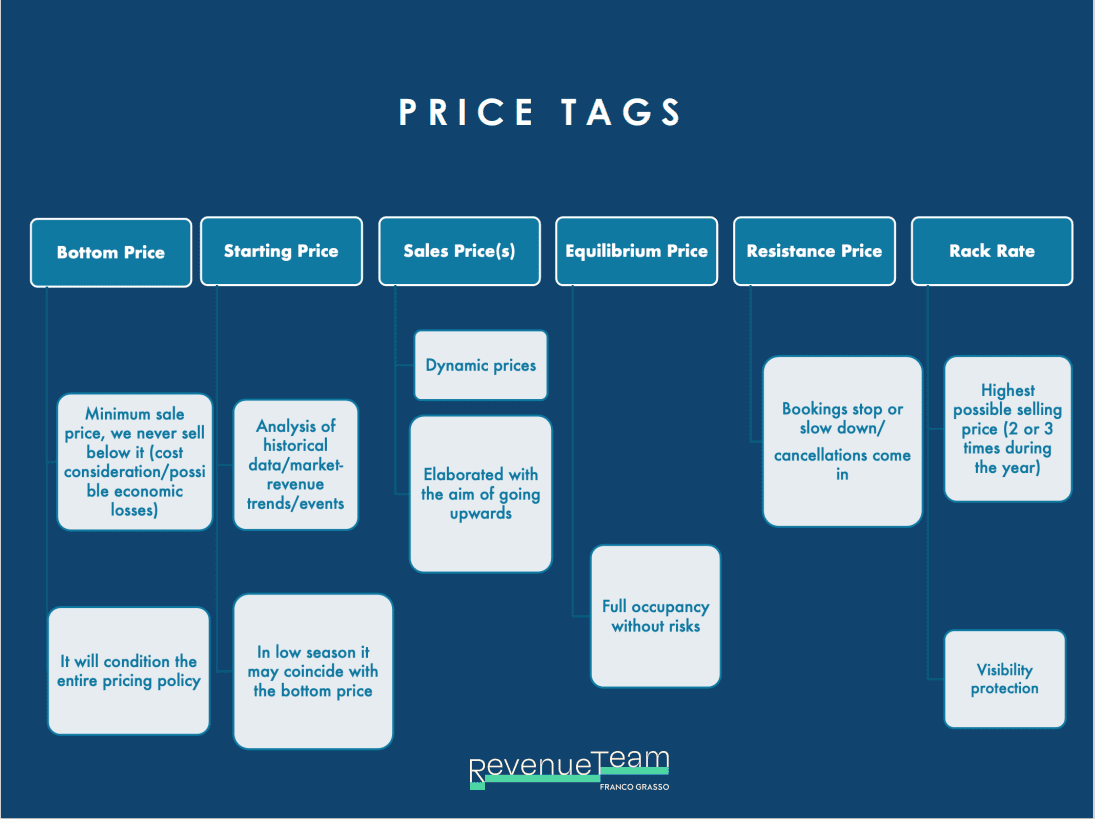
Below you find an overview of six dynamic pricing (Price tag) approaches. In this article, we’ll address and explain all price tags so that you can set the correct room prices for your hotel rooms.
We start by listing the six “price tags” as follows:
- Bottom Price
- Starting Price
- Sales Price
- Equilibrium Price
- Resistance Price
- Rack Rate
What is the bottom and starting price?
Despite their names and similarities, these are two different rates.
The bottom price
The bottom rate is the minimum selling rate. No matter what, your hotel won’t go below this rate for three reasons:
- Psychological (mental resistance to falling below a specific subjective price threshold)
- Economics (it makes no sense to take a loss)
- Legal (imposition of local authorities)
As revenue managers, we consider variable costs, which only apply to occupied rooms. Variable costs include linens, housekeeping, room amenities, etc. We use such costs to come up with the bottom rate.
You can consult this article for an accurate overview of calculating and analyzing fixed and variable costs.
Establishing the bottom rate is essential to profitable revenue management. Why? It identifies ways to maximize the room rates during low demand and last-minute reservations when you have high unsold inventory.
How to define the bottom price
Hotels must increase visibility during the low season and offer enticing rates to attract bookings. Such rates encourage bookings, and guests feel they received a good deal for the money and leave a positive review. Favorable reviews are a cornerstone of dynamic pricing because they improve the hotel’s visibility year-round.
Gaining good reviews in the low season means your hotel has good online visibility in the high season when rates are higher.
As an example, a 3-star hotel might offer a bottom rate of 59$ in low season, gather positive reviews, and when the high season rolls around, be able to sell the same room at $599. It happens.
The starting price
Once you have a bottom price baseline, let’s look at the starting price. Based on your costs and historical data, you decide to apply this initial price to your rooms at least a year in advance. Publishing such rates a year or more in advance allows them the chance to perform their best. Why? Because they can cycle through different market segments throughout the year.
To establish the right starting price, you need data. Specifically, the historical data of the previous year.
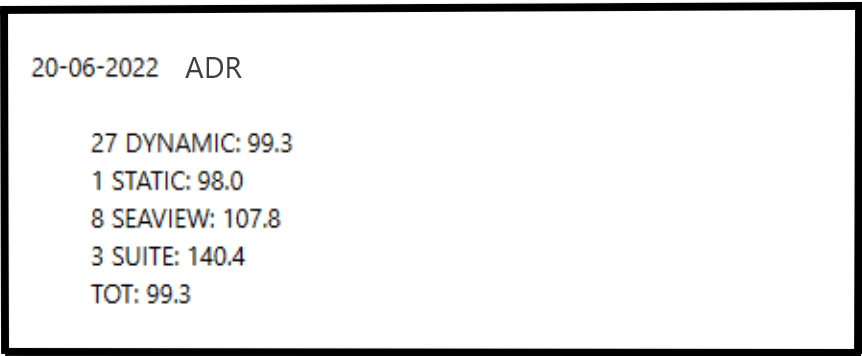
In the graph below, you’ll see the starting price for Monday, June 19, 2023. To establish the starting price, you’ll review the same date as the previous year. In this case, it would be Monday, June 20, 2022.
You’ll analyze the number of occupied rooms on Monday, June 20, 2022, and the rate paid. As a revenue manager, you’ll also analyze the pick-up and average rates for each room type, channel, and market. In terms of market, you can divide between static markets like tour operators and dynamic markets like OTAs. As you may know, static markets work with allotments and fixed negotiated rates while dynamic markets work with dynamic pricing. An RMS (revenue management system) integrated with your PMS (property management system) can give you this data.
With this data, you can start processing the starting price for the date in question for each type of room and each dynamic and static channel.

As a hotelier, you may think Covid impacted the past few years of data. Some analysts even argue the pandemic eliminated the importance of such data.
That’s like seeing revenue management itself is no longer relevant.
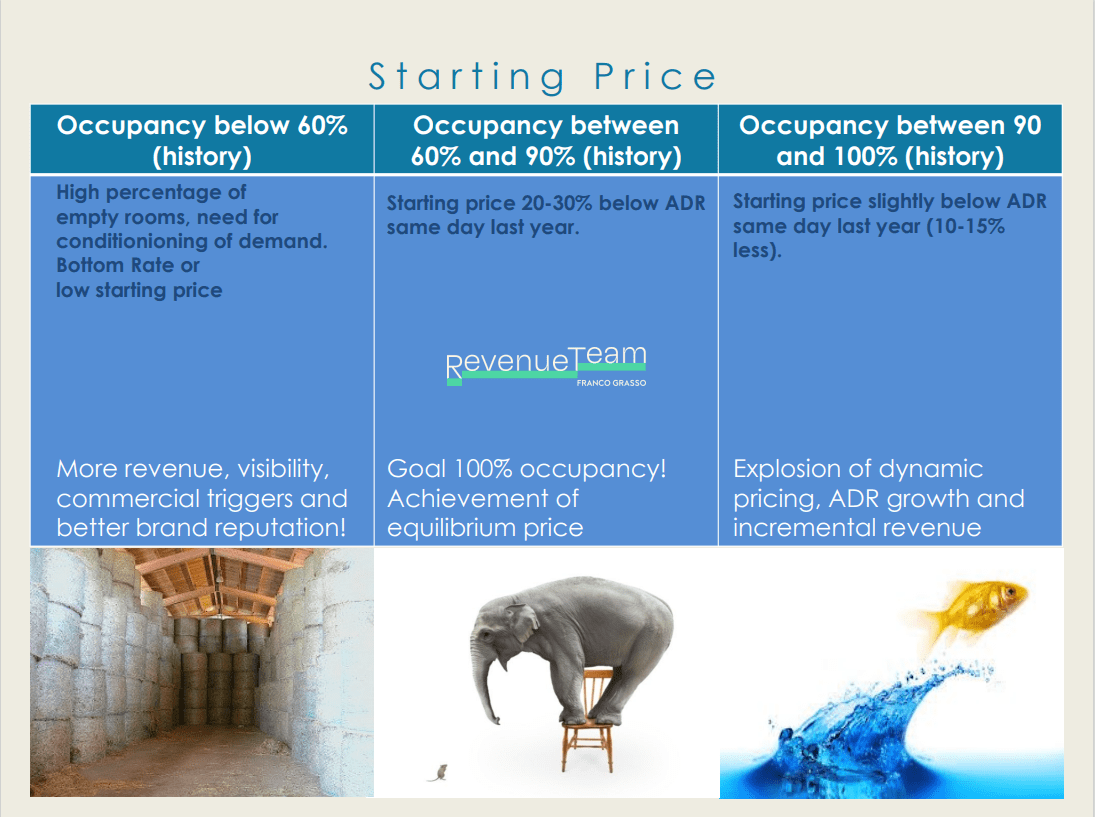
Instead, you can use the most relevant historical data, even a couple or more of years old. You aim to analyze the data you can to determine the starting price. For example, the more unsold rooms you have, the lower the starting rate. Therefore, the more booked your hotel is, the higher the starting rate. If you have a lot of unsold inventory, your starting price may be the same as the bottom rate.
When you look at the ADR (average daily rate) and the distance between the bottom rate and starting rate, it’s proportional to the number of unsold rooms.
Here’s an example
If you’re looking at a new property without historical data, you’ll want to assess the local market. What other hotel types exist in your area, and how should you position your property?
Of course, be aware of inventory and review the data daily so you’re ready to increase prices as the demand and lead time indicate. This process is how you build historical data for the future.
Other historical variables
Other parameters also affect your starting price.
For example:
- What large events are planned for your area (trade fairs, concerts, major sporting events, etc.)
- Market trends or macro factors (competition, destination improvement, etc.)
- Revenue trend or micro factors (brand reputation, visibility, and property ranking)
With these parameters in mind, let’s consider the graphic above. Even with a property with a 100% occupancy rate, it makes sense to start with lower prices than the historical ADR (average daily rate) and then assess and change the prices as demand increases.
Yet, revenue management is a complex discipline, and sometimes, there are instances where it makes more sense to have a starting price higher than the historical ADR. This can be true even if the historical data show a certain percentage of empty rooms.
For example, if you know there’s a large event coming to town, and you’re expecting large numbers of people, it can make sense to start higher than the historical ADR.
Other examples include:
- The destination has greater visibility due to world events (Olympics, Expo, World Cup, etc.)
- Destination infrastructure improvements: railway, airports, etc.
- Review group rates and ensure you’re not accepting a group at meager rates.
- There could be a revenue trend where the property naturally improves its online visibility year over year.
In the latter case, revenue management and its dynamic pricing approach improve online conversion rates.
Higher conversion rates lead to higher rankings in search engines. Additionally, property upgrades and online reputation improvements can improve visibility. With greater visibility, it may be possible to adopt higher starting prices than historical occupancy and ADRs indicate.
While it takes analyzing criteria to guarantee success, it’s worth it. Some small or medium properties have found that finding the right starting price can affect the chances of getting a final successful result by up to 60%. Yes, the correct starting price significantly impacts the results.
With the starting price in place, you have a baseline for your hotel’s dynamic pricing over the coming months. At times, some properties find their bottom price corresponds with the starting price when they’ve historically had a low occupancy rate, and this price never changes all the way through the arrival day.
How to incorporate dynamic selling prices
The heart of Revenue Management is dynamic pricing, which is an art and science requiring data, the right tools, and analytical abilities.
Hotel revenue managers recognize the need to analyze predictable variables but what about those unpredictable variables?
Dynamic pricing requires a balance between historical variables and future forecasts.
The important question is, “what was the situation last year on the same date as this year?”
It helps to understand the hotel’s past performance and make future predictions. For example, if it’s Spring, and you want to predict summer occupancy levels, you can choose a date like April 22, 2023, and look forward to Saturday, July 8, 2023. Compare April 23, 2022, to Saturday, July 9, 2022 (you want to compare weekdays.)
The revenue manager will consider room occupancy then and the rates. They’ll examine how those customers came to the hotel and through which channels. Then, they’ll compare to today’s business. Is it slower? Why? If the property is slower than usual, is it due to room rates? Worsening brand reputation? Is travel down in the destination?
Is occupancy up? If so, why? Should you raise or maintain the rates? Has the property’s reputation improved online? What else could be at play?

The graph above shows that the variables are linked to three main factors: pick-ups, distance to the date (how much time is left to sell the rooms), and sales channels.
Pick-ups and lead time
Pick-up is the number of rooms sold daily or weekly for a specific type of room, for a certain date, and at a particular price.
For example, how many rooms do we need to sell before we can raise the rates? Then, what does that rate raise look like? Is it $5? $20? $50? If you know your time and sales channels, you can automate this with a simple rule. But it’s not that simple and mechanical.
As you know, selling rooms profitably depends on dates, group rates, and other factors.
For instance, selling ten rooms for a particular date in 10 months requires a different price point than ten rooms for the same date in 10 days. Then, selling ten rooms to a tour operator at a flat rate is a different instance from selling ten rooms on online channels at dynamic rates.
Because these are four different scenarios, our revenue management approach also varies. How will we price them? We look at the data.
- How many rooms have historically sold for different price points, such as $99, $109, $119?
- On which channels?
- How long in advance?
You’ll also want to know the average lead time of your hotel and destination. When do your customers start searching online? When do they become more frequent? When do they peak?
This online search window changes from destination to destination. In some cases, it’s as much as 45-10 days for holiday destinations. For those properties that primarily rely on medium-long haul or short-haul visitors, the range can be 20-1 days.
The key is knowing the patterns in the peak and slowdowns as that affects the dynamic pricing.
Once you’ve established your bottom and starting rates, you’ll want to look at the next “price tags,” equilibrium price, resistance price, and rack rate.
Equilibrium price and resistance price
As your room rates increase, you’ll keep an eye on equilibrium pricing and resistance pricing. The equilibrium price is where demand and supply are the perfect match within the average booking window. You can fill your rooms without risk when the maximum occupancy at an ADR higher than the previous year increases turnover.
As a revenue manager, you can analyze historical data, review the pick-ups and market trends to identify the ideal equilibrium price.
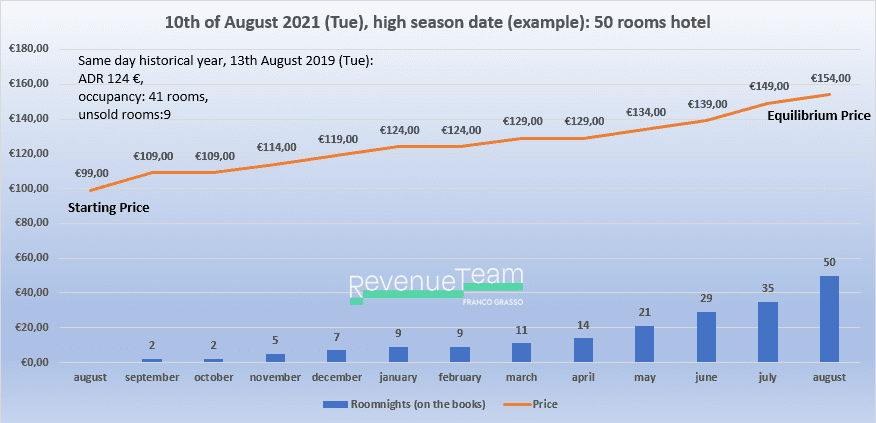
However, sometimes it’s difficult or impossible to reach the equilibrium price. Internal or external factors can lead to incorrectly raising the rate and running into the so-called resistance price, resulting in a block or slowdown of reservations or even cancellations.
When a hotel hits the resistance price it can be for various reasons:
- an excessive or too fast increase in prices
- a worsening of brand reputation
- unfavorable weather close to arrival
- a canceled event
- an economic crisis
- Even incorrect commercial and pricing management of other hotels can affect the entire market.
In some cases, meeting the resistance price can mean balancing, limiting the damage, and getting the best result. As a result, a hotelier needs to review the data and make the necessary corrections.
One such correction is a last-minute price. A last-minute price is a discounted rate applicable when the cancellation policy prevents potential cancellations and rebookings at a lower rate. Depending on the number of unsold rooms, available timing and the average booking window, the last-minute rate could be gradual or dramatic.
It may also coincide with a return to an equilibrium price. If someone made significant pricing errors and the property has too many unsold rooms near the date, the hotel may need to reduce the room rates to the bottom rate.
One of the most complex (and exciting) tasks in revenue management is navigating between these two price tags. Some revenue managers are too cautious which leads to spillage or have a careless attitude leading to spoilage.
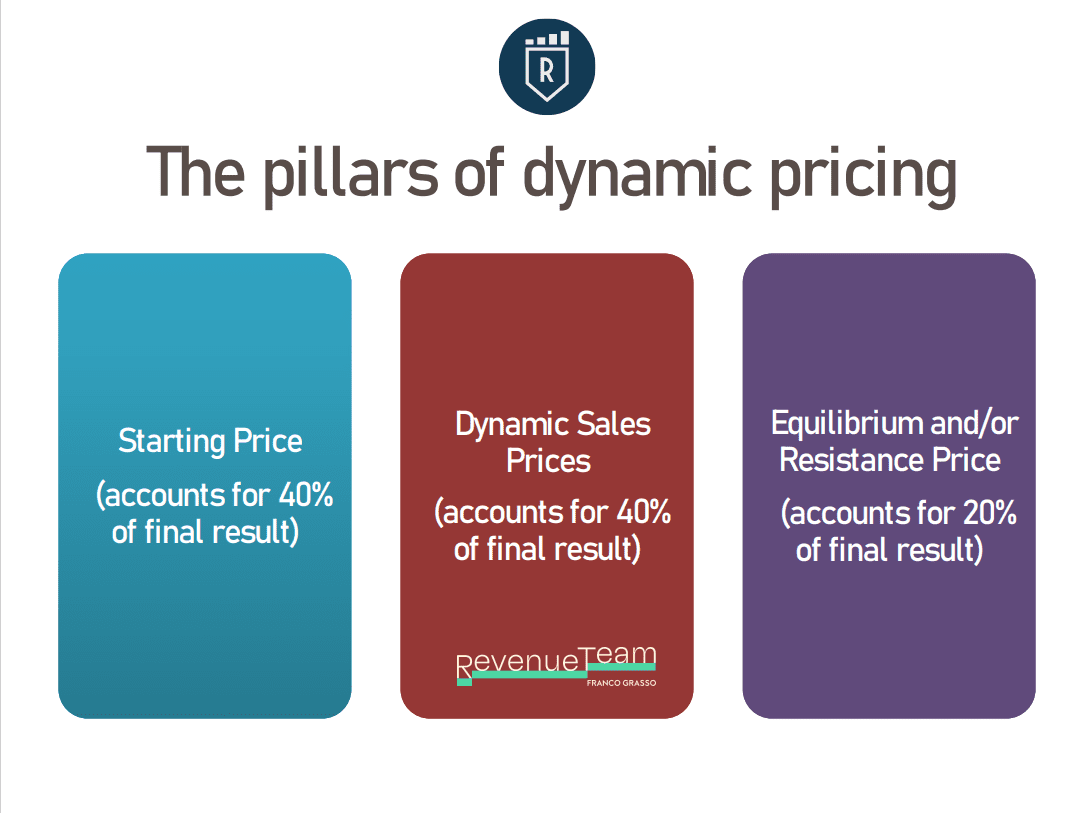
We can summarize these price tags below:
 The final price tag is the rack rate. As you know, the rack rate represents the highest rate you can sell rooms due to demand.
The rack rate
Traditionally, this is the maximum potential rate. Some countries regulate this rate and require its posting within sight of the guest, such as behind the room door.
These rates are the highest, and properties may get them twice or thrice a year during extreme demand. The rack rate serves another vital function too. Maintaining online visibility when the hotel is at 100% occupancy.
This way, you strategically overbook, knowing you’ll have a percentage of cancellations. If your rack rate is sold more than two or three times a year, it’s probably too low.
By now, you can see that dynamic pricing is a complex endeavor. It requires strategic thinking and the ability to analyze numbers. Revenue management blends these components to maximize your room rates.
To manage and automate much of the analysis, you need a good RMS (Revenue Management System.) The RMS can filter and cross-reference the data to deliver the information to the human revenue manager to interpret.
You can hire in-house or outsource your revenue management. Whichever you choose, know they’ll coordinate all the elements of your PMS, reservation team, RMS, OTAs, etc., and chart a path for profitability.
Revenue management brings the sales strategy together, but you need the right software and person to interpret the results. The software will ensure you have the relevant data to inform your revenue pricing strategy.
Such RMS strategic inputs result in the definition for each day of the year for the bottom rates (after cost analysis), starting prices, dynamic, equilibrium, resistance prices, and rack rate. Then, each is distributed daily on all sales online and offline platforms and monitored by human revenue managers.
Ready to boost your hotel’s profits? It starts with dynamic pricing. You can adjust for other factors with the correct bottom and starting prices. Lock in your rates today.
Download this free eBook today if you’re an executive, GM, or hotel owner. Click here to download the Guide “10 Things To Know About Revenue Management”.

