As the world reels from the force of COVID-19, the impact of this pandemic on the real economy (goods and services) remains uncertain. The “Great Lockdown” has resulted in a severe drop in economic activity during the first half of the year, but recent figures suggest that the economy has since significantly rebounded.
Falling GDP vs. buoyant financial markets
Notably, the KOF Swiss Economic Institute at ETH Zurich has revised its June estimate of a -5.1% decline of the Swiss GDP for year 2020 to just -3.6% in October. That being said, this remains the largest economic contraction in decades and, perhaps more importantly, the situation seems to be further deteriorating. Should we begin panicking in the face of what awaits on the horizon? Probably not, given that there is still a large consensus amongst economists that 2021 will mark the return to a positive GDP growth rate.
The KOF anticipates that by 2022 the economy will be back to its pre-pandemic levels. One thing is for sure, financial markets are certainly not panicking – or, at least, not anymore after their historical collapse in spring. In spite of the current situation and the uncertainty about its future evolution, financial markets are surfing on a wave of record-breaking levels, which looks dramatically different from the waves of contagions and bankruptcies crashing into the sanitary system and the real economy.
This raises a few questions: how is it possible to have a falling GDP but a thriving financial market? Are the real economy and the financial markets completely disconnected? Can the difference between the two markets be justified? Are the financial markets in a bubble? The remainder of this article aims to provide the reader with an element of a response to these questions.

Real economy and financial markets
Before examining the arguments that may or may not justify the apparent disconnection between the real economy and financial markets, it is necessary to recall a fundamental difference between the two. When considering the real economy, one typically evaluates variables such as demand, supply, unemployment or price level. For such variables, information about their evolution during past semesters or even quarters is readily accessible for analysis. Financial markets also use this information, but investors go one step further: forecasting. The more investors are able to anticipate the implications of current and future economic conditions, the better their decisions will be, consequently improving their rate of return on investment.
This means that at least part of the current disconnection between the two markets can be justified by differences in their relevant horizons. On the one hand, the economy is still showing the effects of the first wave of COVID-19 (as indicated by presently available data) while we are currently fighting the second. On the other hand, financial markets are already looking towards 2021 and anticipating the effects of recovery plans, arrival of a vaccine, and a more stable international environment under Biden’s presidency.
Financial markets have always functioned this way, but never before has the gap with the real economy seemed so wide. In 2009, for example, the economy was in recession, but stocks were rallying, albeit far from their pre-crisis levels. This year is different, all markets have recovered most of their losses from March, and some have even surpassed their January peak levels. Clearly, the divergence between the two markets cannot solely be explained by a difference in their respective horizons. Other factors need to be examined to determine whether prices on financial markets are still coherent with economic fundamentals or whether they are in a bubble phase – as some believe. It is essential to answer this question because bubbles always end badly: they eventually burst and drag the real economy down with them, as was the case in 1929.
A low interest rate environment is a double-edged sword and is likely the main argument to justify the currently high valuations of certain companies. On one edge, money is cheap and readily available, incentivizing investors to purchase financial assets now, pushing their prices up. On the other edge, the increased supply of money means firms no longer need to offer the same return to investors as they compete to hand over their borrowed money.
Role of long-term interest rates
The figure below shows the historical connection between long-term interest rates and the relative value of stocks expressed as their Price/Earning (P/E) ratio. The P/E ratio indicates the number of years of firm earnings one pays for the price of one share. The P/E ratio is widely used to get a sense of whether a stock or the market as a whole is relatively cheap or expensive as compared to its current earnings. As may be observed in the figure, interest rates reached a historical peak in 1981, coinciding with the lowest P/E ratios since the great depression.
Across the next two decades the negative relation between the two variables becomes even more obvious: low interests help support higher valuations on financial markets, and vice versa. In the short-term, the high valuations can therefore be considered rational. But, in the longer-term, if interest rates rise, performance of financial assets is likely to be disappointing or even negative. Inflation has remained very low and stable for the past 10 years and is hardly mentioned anymore. However, this variable could well resurface as a determining factor. Indeed, several indicators (government and state debt, central banks’ strategy) suggest that it might rise again. If so, this should translate into higher interest rates and a decline in the performance of financial and real assets.
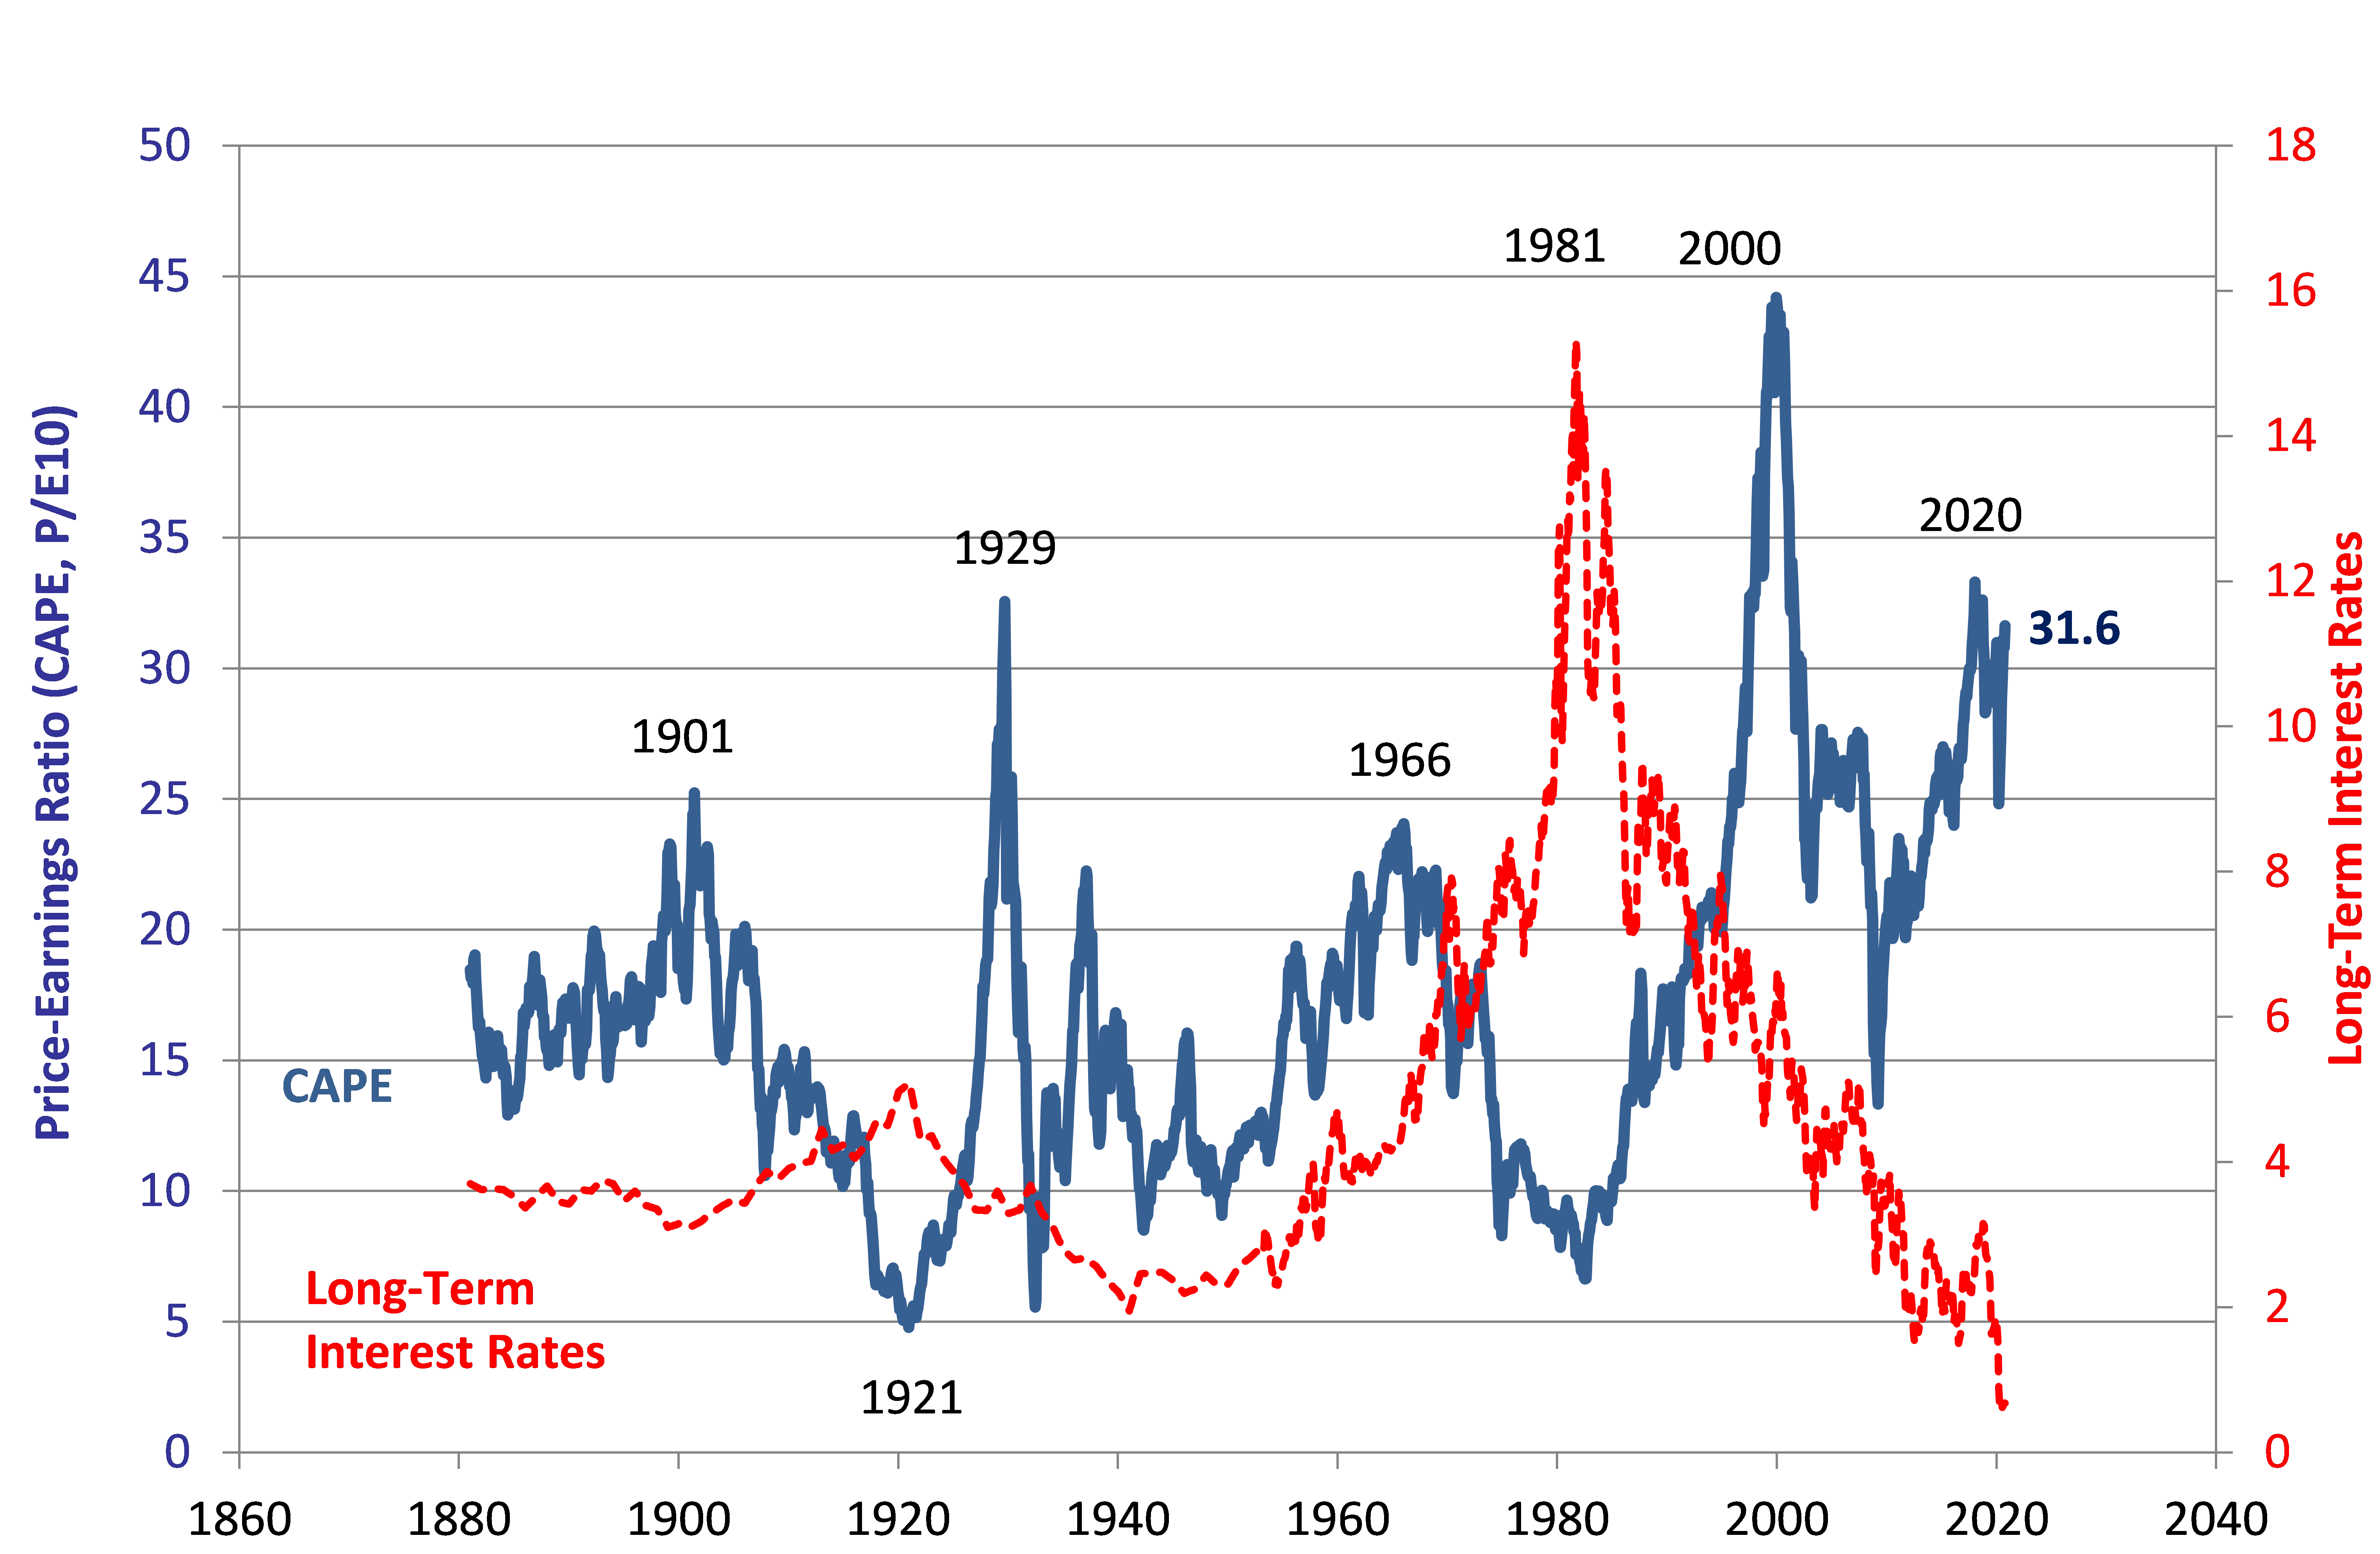
Figure 1: Relation between interest rates and the value of stocks over the long-run, source
“Value stocks” vs. “Growth stocks”
Apart from interest rates and their effect on all assets, it is interesting to note that the nature of this crisis means that there have not only been losers. In fact, the rise of financial markets is driven by a multiplier effect sourced exclusively from the gains of so-called “Growth stocks” with large market capitalizations as compared to other firms in the market. Growth stocks refer to companies such as Facebook and Google that are expected to increase their earnings substantially in the future and are therefore expensive to buy today. These stocks are often compared to “Value stocks” which are just their opposite, i.e. companies from the “old economy” that typically offer less growth potential. For example, Amazon’s market cap has risen above USD 1500 billion, a 60% increase as compared to 2019.
Over the same period, United Airlines has seen its market cap decrease to USD 11 billion, a 60% loss. Amazon’s gain thus more than covers United’s loss and thereby heavily contributes to the rise in financial markets. While this may seem logical at first glance, this also raises the question of whether the high valuation of companies similar to Amazon is realistic. Amazon’s most recent P/E ratio exceeds 105, meaning at the current level, an investor would need to wait over 105 years to receive her fair share of earnings. Compounding this example, Amazon would need to increase its earnings by at least 20% per year over the next ten years for its current valuation to be reasonable. Whether such a scenario is sensible is open for debate.
When will the two markets reconnect?
This article argues that the apparent disconnection between financial markets and the real economy is not totally irrational given the current economic environment, and in particular the level of interest rates. Simultaneously, it highlights the apparent excessive outperformance of the so-called growth stocks as compared to companies from the “old economy”. Are financial markets in a bubble? Probably not … yet. In our opinion, the difference in time horizon of the real market and financial markets coinciding with the current level of interest rates mostly explain the apparent disconnection between the two markets.
Furthermore, it is clear from figure 1 that the relative valuation of stocks is highly cyclical. That is, stocks can remain expensive for relatively long periods but always eventually correct and, as is often the case, remain cheap for several years. Are we close to such a reversal? As we mentioned, the evolution of inflation and therefore interest rates is likely to determine the answer to this question. From this standpoint, it is interesting to mention as a concluding note that never in the past 500 years of history have interest rates been as low as today (Homer and Sylla, 2005).
Bloomberg data summary:
| Amazon | |
| Market Cap 31/12/19 | USD 923bn |
| Market Cap 30/09/20 | USD 1587 bn |
| Difference | 664bn |
| Gain | 71.2% |
| Amazon P/E ratio 12/31/2019 | 83.38 (Bloomberg) |
| Amazon Max | 132.86 |
| Amazon 30/06/20 | 106.38 |
| United | |
| Market Cap 31/12/19 | USD 22.136bn |
| Market Cap 30/09/20 | USD 10.422bn |
| Difference | 11.71bn |
| Loss | -52.92% |
| United P/E ratio 12/31/2019 | 7.61 |
| United P/E ratio Minimum 2020 March 19 2020 | 1.83 |
| Latest: June 30 2020 | 6.69 |