With surging COVID-19 infection rates and most schools now back in session, it’s not surprising that U.S. hotel occupancy continues to dip.
Occupancy, down to 63.7% in the week ending Aug. 21, has fallen by two percentage points or more in each of the past three weeks, according to the latest weekly data from STR, CoStar’s hospitality analytics firm. On a total-room-inventory basis, which accounts for temporarily closed hotels, weekly occupancy was 61.3%.
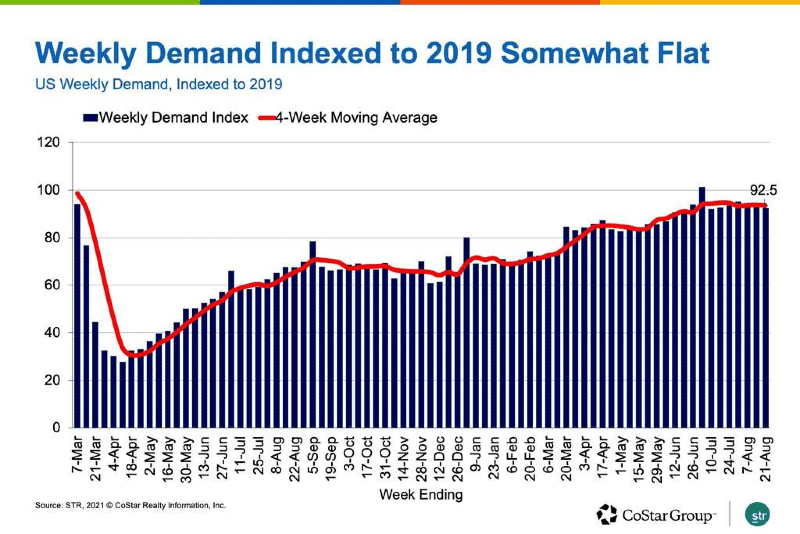
While increased COVID-19 cases are likely affecting demand, most of the loss appears to be seasonal. In 2019, from mid-July to mid-August, U.S. hotel demand fell by 2.8 million rooms as schools went back into session. In the same five weeks of 2021, demand fell by 2.9 million rooms — or 125,000 more than in 2019. Overall, the industry sold slightly more than 92% of the rooms it did in 2019. Compared with five weeks ago, the demand index to 2019 is down 1.1 points.
Florida’s hotel markets recorded the largest decrease in demand, and markets in 42 other states also had weekly declines. Compared to the same week in 2019, hotel demand was higher in 18 states. The number of states above 2019 demand levels has been in the mid-to-high teens for the past seven weeks. Another 22 states reported demand that was 90% of 2019 levels, and the percentage of states at that level also has changed little over the past seven weeks.

Demand was also lower across 71% of the 166 STR-defined markets.
The worst dip was in Orlando, which sold 84,000 fewer room nights in the week — 66% of the rooms sold during the comparable week in 2019, the lowest level of the past 14 weeks.
However, 75 markets continued to report demand that was higher than what it was in the comparable week of 2019. That number is higher than it has been the previous two weeks.

Of all markets, 77% reported hotel demand 90% or more of what was achieved in the same week in 2019. That percentage has changed minimally in the past seven weeks.
In total, the U.S. sold 24.5 million rooms in the week, or an average 3.5 million per day, down from 3.6 million per day in the previous week. At its summer peak five weeks ago, the industry sold an average of 3.9 million rooms per day.
Average daily rate also declined for a third straight week, down 2.6%. The largest declines were during the weekend outside of the top 25 markets. Indexed to 2019, nominal ADR has been above its 2019 level for eight weeks, while real ADR — adjusted for inflation — has been at the 2019 level in six of the past eight weeks. There were 135 markets with weekly nominal ADR higher than what it was in 2019, the most since the beginning of July. Among the top 25 markets, 12 reported higher nominal ADR than in 2019 despite most having lower demand and occupancy.
Total-room-inventory RevPAR fell for the fourth straight week, down 5.7%, and was 93% of the level achieved during the comparable week in 2019. The index to 2019 was down 1.5 points from the previous week. On an inflation-adjusted basis, RevPAR was 88% of the 2019 level.

In all, 126 markets (75%) reported declines in weekly RevPAR, and the index to 2019 declined for slightly more than half. At the same time, 100 markets reported RevPAR higher than what it was in 2019, down from 101 markets in each of the previous two weeks.
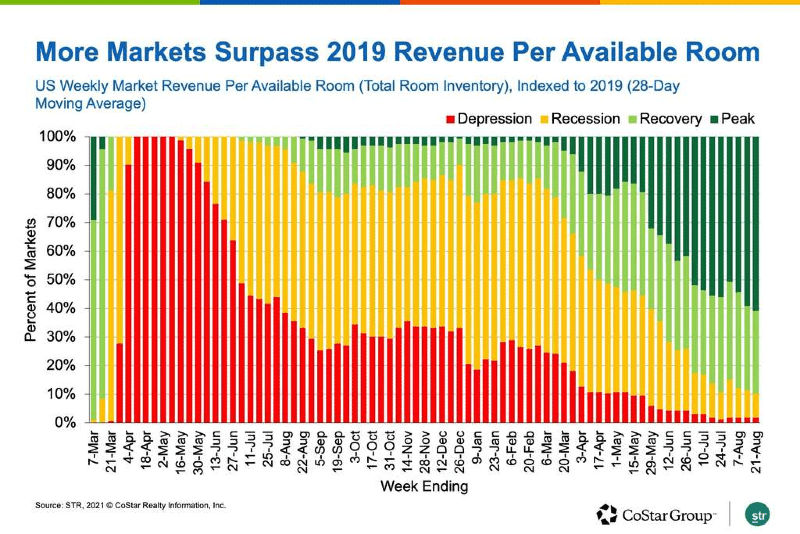
On a 28-day moving average, 101 markets had RevPAR higher than what it was in 2019, which STR’s Market Recovery Monitor classifies as “peak” performance. That number is the highest of the pandemic era.
Forty-eight markets were in “recovery,” with RevPAR between 80% and 100% of 2019 levels. Only 17 markets were in “recession,” with RevPAR between 50% and 80% of 2019 levels, or “depression,” achieving less than 50% of 2019 RevPAR.