 The U.S. hotel industry is heading to its annual occupancy apex, which normally occurs in mid-July for the U.S. and mid-August for the remainder of the globe.
Despite rising prices, the U.S. industry is on track to see record demand in June. If the trend continues, July could see the highest U.S. monthly demand ever recorded by STR, CoStar’s hospitality analytics firm.
However, travel hassles, such as airline disruptions, combined with rising prices may impact the industry and dampen demand, especially once the summer leisure season is over. It’s not difficult to imagine a decline based on all the news reports, but it is tough to quantify the impact given the current surge in travel and spending.
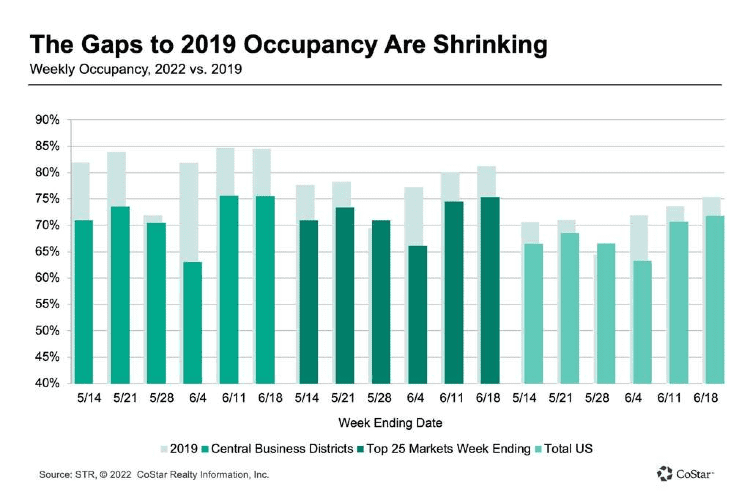
During the week ending June 18, U.S. hotel performance strengthened further with occupancy at a pandemic-era high of 71.8%, which was up 1.2 percentage points from the prior week and 4.1 percentage points versus the matching week last year.
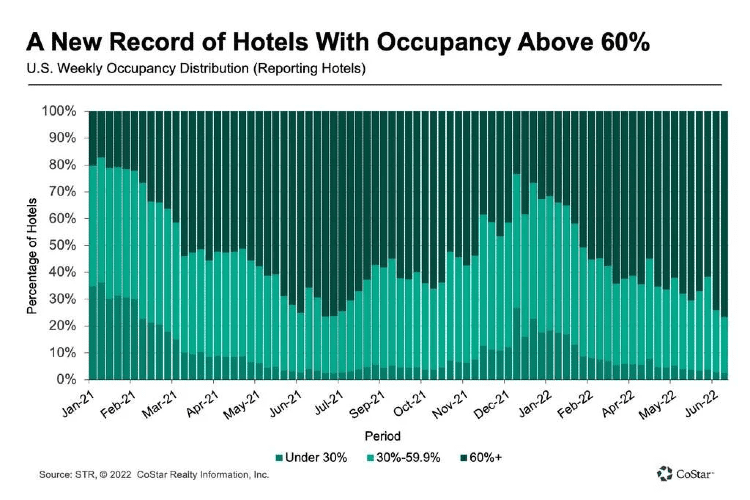
Nearly 40% of reporting hotels saw occupancy surpass 80% for the week. This was the highest percentage since last summer. More notable, 39% of large hotels with more than 300 rooms were above 80%, up from the week before, and the highest such percentage since the start of the pandemic. While this is good, there is still plenty of room for further recovery. In the comparable week of 2019, 64% of large hotels were above 80%.
Weekly room demand was 28.1 million, the highest since the week ending Aug. 10, 2019, and 98% of the level seen in the comparable week of 2019. Demand has been at 90% or greater of the levels seen in 2019 for the past 18 weeks, specifically 97% on average.
Group demand fell from its pandemic-era high last week to the fourth best this past week. The decline was nearly evenly split between weekdays (Monday to Wednesday) and weekend (Friday and Saturday). Group demand for shoulder days (Sunday and Thursday) was 99% of what it was in the comparable week of 2019 as weekdays were at 95%.
Nominal average daily rate was flat at $155 week on week but up 19% compared with last year and 15% better than in 2019.
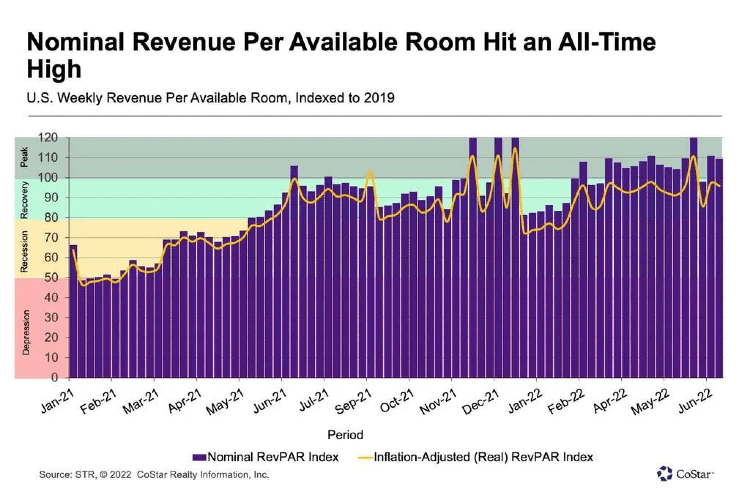
Nominal revenue per available room hit an all-time high at $111, surpassing the previous high set just one week earlier. Prior to the last two weeks, the record for nominal weekly RevPAR was in the period ending July 28, 2018, when it was $107. This most recent week’s nominal RevPAR was 9% higher than what it was in 2019 and 27% greater than a year ago.
Market Highlights
In the top 25 markets, 47% of all hotels, regardless of size, were above 80% occupancy, which was the highest percentage of the pandemic era but 13 percentage points lower than what was seen in 2019. Forty-six percent of large, upper-upscale hotels in the top 25 markets surpassed 80% occupancy. This group of hotels is seeing a good recovery trend, but it is still 25 percentage points below 2019 when 71% of large, upper-upscale hotels in the top 25 markets were above 80%. A year ago, the gap was 59 percentage points.
Occupancy within the chain scales ranged from 77% in upscale to 65.8% in economy. Upscale occupancy was the highest since the start of the pandemic, while upper upscale (73.9%) saw its second highest level — behind last week’s pandemic-era high. Taking a longer view, midscale and economy began the year with room demand above 2021 comparables. In the past four weeks, however, demand for midscale hotels has fallen below last year’s level. Since mid-March, economy hotels have seen less demand than they did a year ago.
The remaining chain scales are all seeing stronger demand this year than they did in 2021. Over the past four weeks, demand is above 2019 levels in upscale, upper midscale and midscale. Also, demand is at an all-time level — four-week total compared to the same four weeks across all years — in upscale and upper midscale, surpassing the previous record seen in 2019. Luxury and upper upscale are 4% off 2019 and well below their high for the period
For the second consecutive week, Alaska led the nation in weekly market occupancy, at 90.3%, followed by New York City, at 86.6%. Ninety-one markets, the most of the pandemic era, reported occupancy of more than 70% with 13 above 80%. Twenty markets reported their highest occupancy of the pandemic era, including Boston (84.7%), Chicago (79.1%), Nashville (78.7%), San Diego (86%), Philadelphia (71.1%) and Washington, D.C. (76.3%). Occupancy in the top 25 markets reached a pandemic high at 75.3%, including during the weekdays, when it reached 76%. Across the entire U.S., weekday occupancy was 71.9%, the best since late October 2019. Occupancy in central business districts was virtually unchanged week to week for the full week at 75.5% but at a pandemic high for weekdays at 79%.
Nominal ADR showed little change week on week, finishing at the third highest level since the start of COVID-19. However, ADR fell week on week in the top 25 markets and central business districts both by 1.9% but was up year over year 32% and 45%, respectively. Inflation-adjusted ADR — or real ADR — increased 11% year on year and was slightly above 2019’s level. This was the second consecutive week that real ADR was above 2019 and the ninth time this year. Real ADR in the top 25 markets and central business districts was right under what it was in 2019. Nearly all markets (96%) had nominal ADR above 2019, with 57% reporting real ADR above 2019 in the current week. Over the past 28 days, 61% of markets had real ADR above 2019.
Along with achieving a new record for the highest weekly nominal RevPAR ever recorded by STR, real RevPAR was the best of the pandemic thus far but far from a record. Among the top 25 markets and central business districts, nominal and real RevPAR was the second highest since March 2020. Seventy-eight percent of markets reported nominal RevPAR above 2019 with 45% seeing the same based on real RevPAR. Across the last four weeks, 46% of markets had real RevPAR above 2019, which we label as “peak.” Another 49% had real RevPAR in “recovery” — RevPAR indexed to 2019 between 80 and 100. The good news is that only 5% of markets were in “recession” — RevPAR indexed to 2019 between 50 and 80 — over the past 28 days.


