U.S. airport security screenings were up, but hotel demand was down in the latest weekly data, particularly in the country’s largest markets and among hotels that typically rely on significant group and corporate business.
The decline in U.S. hotel performance is surprising, coming after two weeks of gains that indicated better-than-expected business travel. Normally, an uptick in air passengers yields an increase in hotel demand. This week was an exception with occupancy slipping 1.5 percentage points to 61.7%.
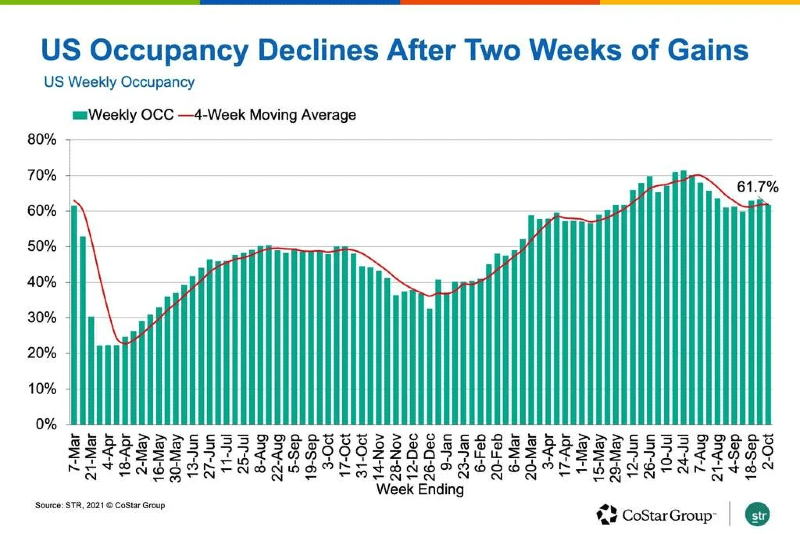
Compared to the previous week, both weekday and weekend demand declined, with 27% of the week’s demand loss occurring on Thursday. On a total-room-inventory basis, which accounts for temporarily closed hotels, weekly occupancy was 59.4%. A little more than 48,000 rooms remain temporarily closed, mostly in New York City, Orlando and San Francisco.
Weekly demand declined the most among hotel types that have traditionally served business and conference guests: Upper-upscale, upscale and upper-midscale. These three chain scales accounted for 71% of the weekly demand loss among reporting hotels. In previous weeks, hotels of this profile were the primary benefactors of the industry’s demand growth.
Group demand, which had previously risen for six consecutive weeks, fell 8% from the previous week. Overall, demand fell during the week for 56% of all U.S. hotels reporting to STR, with hotels selling 15 fewer rooms on average versus the week prior.
Demand declined in 66% of U.S. hotel markets, most noticeably in the country’s largest markets, including New York City, Chicago, Orlando, San Diego and Seattle. Previously, New York City hotel demand topped 500,000 for three consecutive weeks, which was the market’s best run since the pandemic’s start. The largest weekly demand gains were recorded in Atlanta and San Francisco.
The week-over-week demand decline was the second of the past five weeks and the largest since the week before the Labor Day holiday. The good news for U.S. hotels is that demand — the number of hotel rooms sold — has remained above 23 million for the past 19 weeks.
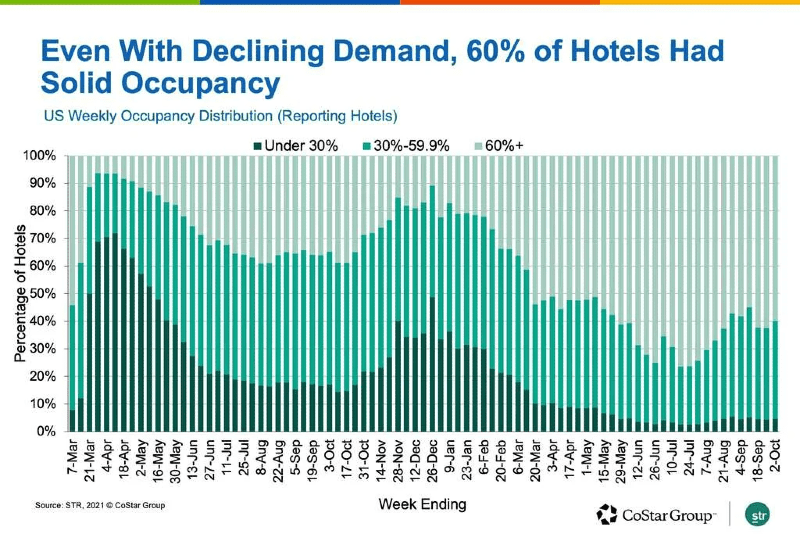
Despite the overall decrease, U.S. hotel demand indexed to 2019 rose on easy comparisons due to the timing of the observance of Rosh Hashanah. For the month of September, the industry sold an estimated 93% of the comparable 2019 room volume, which was up from 90% in August.
U.S. hotel average daily rate also decreased, falling 2.3% from the previous week, marking the second decline of the past five weeks and the largest in that period.
The largest ADR declines occurred in top 25 markets, which were down 3.5% from the previous week while all other markets were down 1.5% in ADR.
Weekday and weekend ADR declined by roughly the same amount on an industry basis. However, the top 25 markets showed a sharp reduction in weekday ADR, plunging 4.5% with the largest decreases coming early in the week.
Weekly total-room-inventory revenue per available room indexed to 2019 increased in the week even as RevPAR declined 4.9% on an absolute basis. Again, that’s because of the easy comparisons due to Rosh Hashanah falling during the corresponding week in 2019. Taking the 2019 observance into account, we estimate the RevPAR index would have remained in STR’s “recovery” category, with total-room-inventory RevPAR between 80% and 100% of 2019 levels, as it has been for 16 weeks.
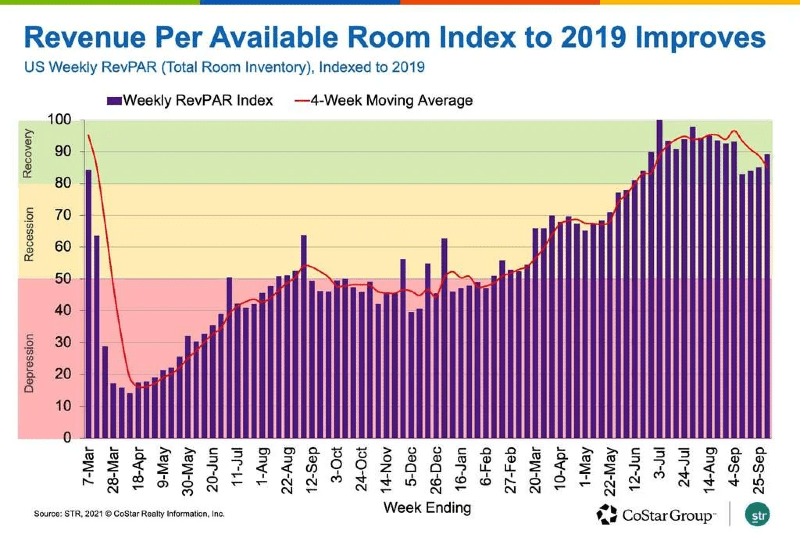
On a 28-day moving total basis, the index continued to weaken from its summer highs, down to 85 from 89 in the prior week.
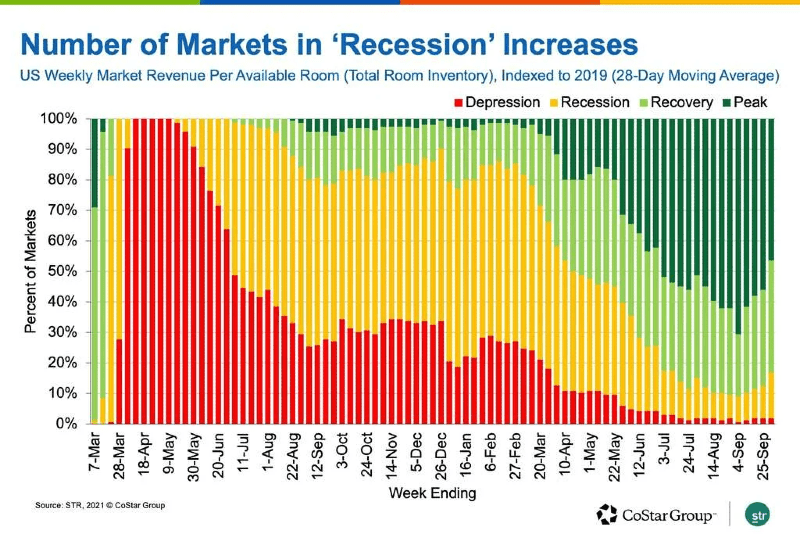
The percentage of markets at “peak,” with total-room-inventory RevPAR more than 100% of 2019 levels, also declined to 46% from 56% a week prior. Thirty-seven percent of markets were in “recovery” and 15% were in “recession,” with total-room-inventory RevPAR between 50% and 80% of 2019 levels. The percentage of markets in “recession” was the highest of the past 14 weeks. Three markets remained in “depression,” with total-room-inventory RevPAR below 50% of 2019 levels. San Francisco remains at the bottom of the index, with RevPAR only 34% of its 2019 level.
